Elevate your manufacturing strategy with key resources
Download our Technological Maturity Self-Assessment & Strategic Vision Exercise tools to assess your software ecosystem profile and to plan for future growth.

In this comprehensive case study, we delve into the strategic planning of a fictional manufacturing company preparing for its quarterly review meeting. By analyzing key performance indicators (KPIs) and leveraging a manufacturing strategic dashboard, the company reviews its performance over the last few months. Discover how effective data aggregation and strategic decision-making tools can enhance operational efficiency and drive business success.
In anticipation of the meeting, the company’s Business Intelligence team will work to create a dashboard that will be shared with the company’s senior management. The dashboard should provide key information about the company’s overall objectives, such as performance for the previous quarter, and the impact of the changes discussed at the previous meeting. To do this, it will focus on several key indicators (revenue, costs, profits, etc.).
Beyond simply conveying information, we’ll look at how the team fulfills their mission by sharing the results from their analyses, which actions to take moving forward, and finally, the impact that these actions will have on the company.
The fact is, in today’s very competitive entrepreneurial environment, having the right information is key to implementing a successful overall strategy. The company’s leaders will therefore need effective tools to help them make decisions, and the strategic dashboard is designed precisely for this purpose.
In most cases, a company’s decision-makers don’t have the time or expertise necessary to analyze and process the huge amounts of data available, and will rely on a dedicated team to do this.
This means that an effective strategic dashboard doesn’t make readers do the interpreting work: the dashboard presents conclusions directly, along with the corresponding recommendations. As Avinash Kaushik so aptly says, the meeting “becomes a discussion about the actions rather than an argument about the data. That is how you know you are winning.”
This is surely the most important step of the process, because it leads to a formal framework for dashboard creation. The team asks some important questions to serve as a project roadmap.
This type of dashboard should enable the company to address the following issues:
The dashboard will serve to help leaders define objectives and strategies for the company in general.
The dashboard will be divided into 2 main categories:
The company knew that it was important to shift to 4.0, successfully building a modern IT infrastructure. It automates data extraction and processing, which presents a significant advantage by ensuring high-quality, comprehensive data.
The team therefore doesn’t have to load data from different sources and process them to generate the above-mentioned KPIs. Finally, different data analysis techniques are applied to help others understand and explain the results.
The dashboard has three main parts:
Let’s look at each of these parts in more detail.
For easier reading and navigation, the dashboard is separated into three sections in different tabs. In a dashboard, the important KPIs generally appear in a visible location at the top of the page, and then the tables and graphs are placed at the bottom.
The company decided to invest in custom software that provides access to a dashboard.
Having good visibility on your key performance indicators (KPI) allows you to make informed decisions to improve production processes, reduce costs and satisfy customers. In addition, a good understanding of these indicators can help you anticipate market trends and develop strategies to maintain and increase your company’s competitiveness.
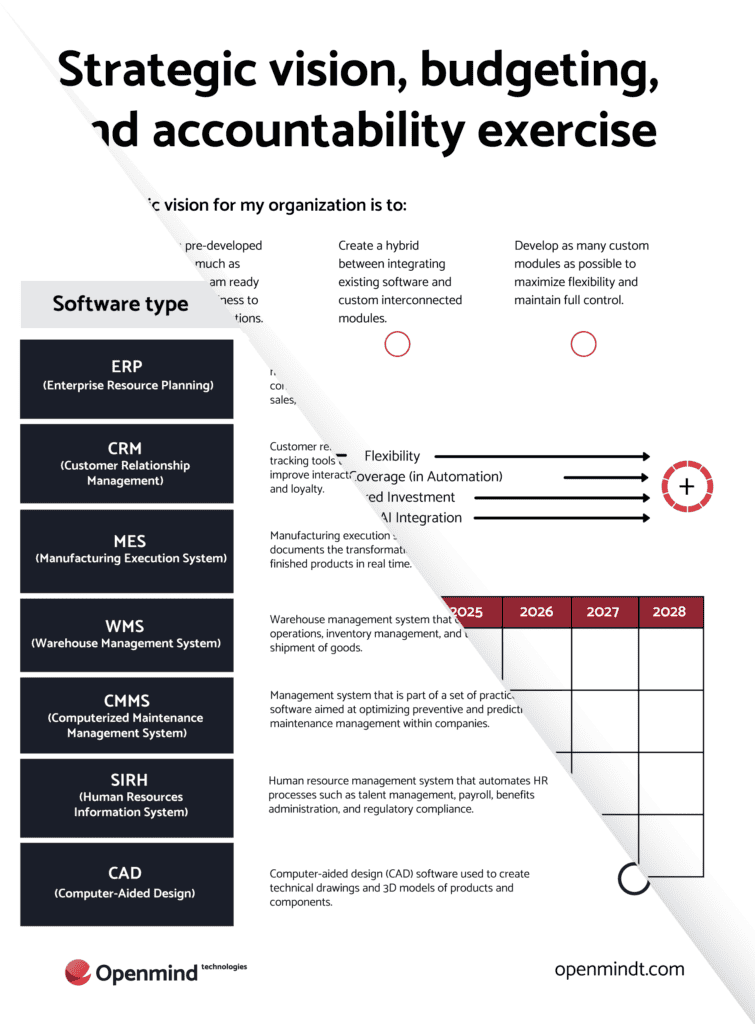
Download our Technological Maturity Self-Assessment & Strategic Vision Exercise tools to assess your software ecosystem profile and to plan for future growth.
Tab 1: The key takeaways
The first page of the dashboard helps with decision-making, because it groups the most important information that requires attention from decision-makers by highlighting the results of the analysts’ research.

As mentioned above, leaders will focus their discussion on the different information presented and the resulting actions.
For example:
With all of this information, leaders will know exactly what to focus on during the meeting, and to really study the issue, they will be able to interact with the data in the “Costs” and “Human Resources” section if they feel like they need more details.
Tab 2: Cost analysis
This part covers the financial side of the company and contains 3 sub-sections:

Tab 3: Human resource analysis
Employees are a company’s main asset, and there should be a section dedicated to them in the dashboard. This section contains 3 sections.

Subscribe to receive our exclusive updates directly to your email.

After long discussions, the meeting ends, and a series of actions should be proposed. Unlike at a standard quarterly meeting, because of the dashboard, this one was able to provide an overview of the company’s various strategic performance indicators. With this clear picture, the decision makers now know which very precise actions to take.
Once these actions are in place, new questions will certainly arise, and the team may need to conduct additional analyses to answer them, but it will be much more clear which direction to take. This exercise should be viewed as an ongoing process, and through improvement, companies can set themselves apart from the competition.
When planning for your quarterly review meeting, it’s crucial to understand the various types of dashboards available to effectively monitor and analyze performance metrics. Our comprehensive guide on The Different Types of Dashboards provides valuable insights into the unique features and applications of each dashboard type, helping you choose the best fit for your manufacturing strategic needs.
The RevOps Approach: a Strategic Asset for the Manufacturing Industry
Discover how the RevOps approach optimizes processes, aligns your teams and maximizes your performance in the manufacturing sector. A key strategy for doing more with less.

Modernization & AI in the Steel Industry: 2025’s Sector-Transforming Trends
Discover how Modernization & AI are transforming the steel industry in 2025. From ERP upgrades to rising AI adoption, learn about the trends reshaping operations, boosting productivity, and helping companies gain a competitive edge through digital transformation.

The Secret Lever of High-Performing Steel Companies: AI-Infused Code
AI-infused code is revolutionizing the steel industry, enabling companies to automate processes, optimize delivery planning, and reduce operational risks. Learn how proprietary custom code is the key to unlocking AI's full potential.

Subsidy and Financial Assistance Programs for Businesses in Quebec & Canada
Explore key subsidies and financial assistance in Quebec and Canada for business growth, productivity, and digital transformation. Discover the ideal program for your business.

From Startup to Web Consent Leader: the Rise of Axeptio With Romain Bessuges-Meusy
In this episode, we chat with Romain Bessuges-Meusy, CEO of Axeptio, a company pioneering consent management for websites and mobile apps.

What is Middleware? Definition, Benefits, and Key Examples for Business Integration
Middleware is the essential software that connects various business applications, enabling seamless data exchange and improving system interoperability. Discover the types of middleware, its key benefits for industries like manufacturing and distribution, and real-world examples that highlight its importance in modern business operations.

Custom Software Lifespan: How to Maximize Its Useful Life & Value
The lifespan of custom software can vary widely based on factors like technological choices, company needs, and technical debt. This article explores why some software needs modernization sooner than others and offers strategies to maximize its longevity. Learn how to effectively manage technical debt and invest in ongoing maintenance to keep your software efficient and relevant.

8 Practical Steps to Implement AI in Steel Manufacturing for Sustainability
Integrating AI into your steel business is simpler than you think. Follow these 8 actionable steps to streamline operations, enhance efficiency, and gain a competitive edge in the steel industry.
How to Adopt AI at Low Cost: a Guide for Manufacturers and Distributors
In this episode, Éric Legault from Eficio shares key steps for low-cost AI integration and the benefits of on-demand CIO coaching to bridge technology gaps.
Tell us more about your needs so that we can better route your project to our specific SWAT team.
1
During the brainstorming phase, we work with you to identify potential solutions to your business challenges to generate the technology response that aligns with your business objectives.
2
Through our requirements gathering process, we work closely with you to define and prioritize your needs, ensuring that our solutions are tailored to meet your specific requirements.
3
This phase marks the beginning of our partnership. We’ll finalize the project plan and establish clear communication channels to ensure a smooth and successful project execution.